GrowthHackers Community
Unlocking Growth. Together.
Leverage the power of GrowthHackers Community to connect with growth professionals facing similar challenges
-
Invite-only
-
100% Free
Ideal for founders, heads of growth, marketers, product managers, and innovators who want to share experiences and collaborate for business growth and career development
There are Many Paths Towards Business Growth
From connecting to peers in a global community, to gaining access to the right professional guidance, here is the next step in your growth journey.
Services Cohort
What if you could have the creators of the growth methodology working on your business? We will select 10 companies only for our 2024 Growth Services Cohort.
Community
Join a vibrant community of forward-thinkers, entrepreneurs, and growth enthusiasts eager to supercharge their business growth.
University
Take your next Growth Certification with up to 70% off during Black November at Growth University. Master breackout growth today!
APPLICATIONS OPEN
What if you could have the creators of the growth hacking methodology working on your business?
We will select 10 companies only for our 2024 Growth Services Cohort, and put the GrowthHackers team to work!
Everything needed, from strategy and culture to experimentation and testing, our global growth team is ready.

STAY UPDATED
GrowthHackers Newsletter
Subscribe to our weekly wrap-up on all things growth. Receive the best-curated content from the community, get notified of upcoming events, and receive our weekly news digest on all things impacting the work of growth.
GrowthHackers Conference
Our annual gathering has ended, and what a fantastic experience it was to bring growth enthusiasts from 107 countries together for another GrowthHackers Conference! We want to express our gratitude to our vibrant global community, and to our wonderful keynote speakers, who made our day-long immersion into the world of growth truly memorable.
If you missed the event, there is still time to get recordings. Discover essential tools for optimizing marketing, leveraging AI, and fostering product innovation do drive sustainable growth in any economy.
Explore insights from industry leaders at top companies like Adobe, Amazon, and Etsy, as they reveal strategies and case studies to drive business growth through experimentation.
If you got an on-demand ticket for the event, check your inbox for instructions on how to access the replay.

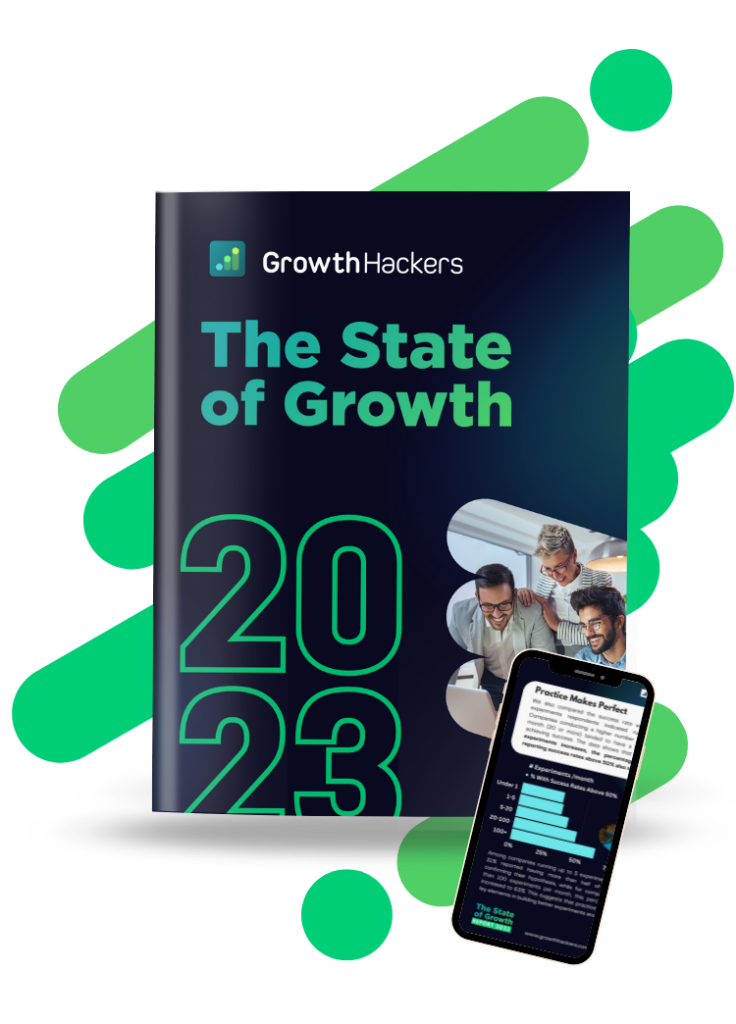
The State of Growth
Access our yearly report on the work of growth teams across the globe. We have surveyed hundreds of growth professionals to gauge perceptions on the challenges their are facing in 2023, how teams are adapting, strategies, benchmarks and more.
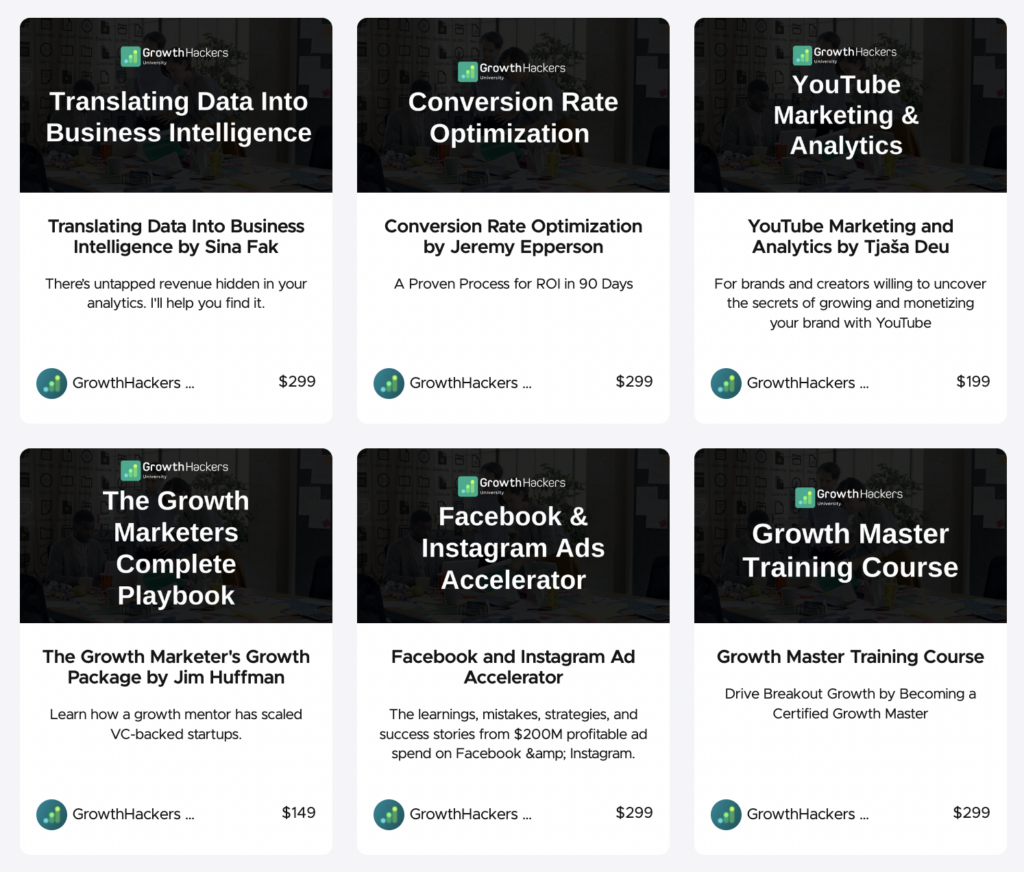
GrowthHackers University
Find out how to boost business growth using targeted marketing, advanced software, CRO, data, and artificial intelligence. Take the next step in your career with courses on growth, marketing, and product.